
In my work on OpenStack Nova, I often have multiple patches in flight somewhere on the CI system. When patches are first submitted (or resubmitted) they go into Zuul’s “check” queue for a first pass of the tests. After a patch is approved, it goes into the “gate” queue, which is a serialized merge process across all the projects. Keeping track of one’s patches as they flow through the system can be done simply by waiting for Jenkins to report the job results back into Gerrit and/or for the resulting email notification that will occur as a result.
I like to keep close watch of my patches, both to know when they’re close to merging, as well as to know early when they’re failing a test. Catching something early and pushing a fix will kill the job currently in progress and start over with the new patch. This is a more efficient use of resources and lowers the total amount of time before Jenkins will vote on the patch in such a case.
Since Zuul provides information about what’s going on, you can go to the status page and see all the queues, jobs, etc. The problem with this is that the information from gerrit (specifically owner and commit title) isn’t merged with the view, making it hard to find your patch in a sea of competing ones.
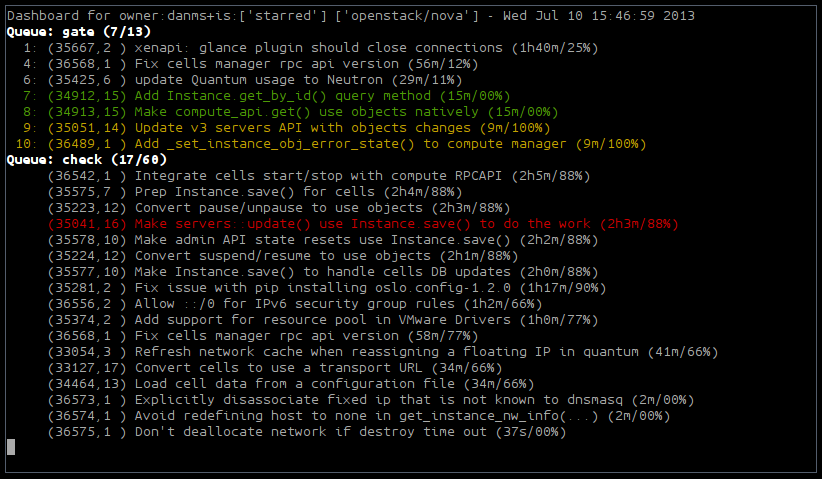
To make this a little easier on the eyes, I wrote a very hacky text “dashboard” that merges the information from Gerrit and Zuul, and provides a periodically-refreshed view of what is going on. After contributions and ideas from several other folks, it now supports things like watching an entire project, as well as your own contributions, your own starred reviews, etc. Here is what it looked like at one point on the day of this writing:
The above was generated with the following command:
python dash.py -u danms -p openstack/nova -r 30 -s -O OR -o danms
Basically, the above says: “Show me any patches owned by danms, or in the project openstack/nova, or starred by danms, refreshed every 30 seconds”. This provides me a nice dashboard of everything going on in Nova, with my own patches highlighted for easier viewing.
Patches of my own are highlighted in green, unless they’re already failing some tests, in which case they’re red. If they are in the gate queue and dependent on something that is also failing tests, they will be yellow (meaning: maybe failing, depending on where the failure was introduced).
You can see the gate queue at the top, which has fifteen items in it, seven of which are matching the current set of view filters, as well as the jobs and their queue positions. Below that is the (unordered) check queue, which has 58 items in it. Each job shows the review number, revision number, title, time-in-queue, and the percentage of test jobs that are finished running. Note that since some jobs take much longer than others, the completion percentage doesn’t climb linearly throughout the life of the job.
The dashboard will also provide a little bit of information about Zuul’s status, when appropriate, such as when it enters queue-only mode prior to a restart, or is getting behind on processing events. This helps quickly identify why a patch might have been waiting for a long time without a vote.
If you’re interested in using the dashboard, you can get the code on github.